In the Reports section of ETR you can do the following:
- View the available Data Analysis Reports drawn from Performance and Proficiency Database (PPDB), on the screen
- View Training notes, i.e. notes written by instructors/examiners
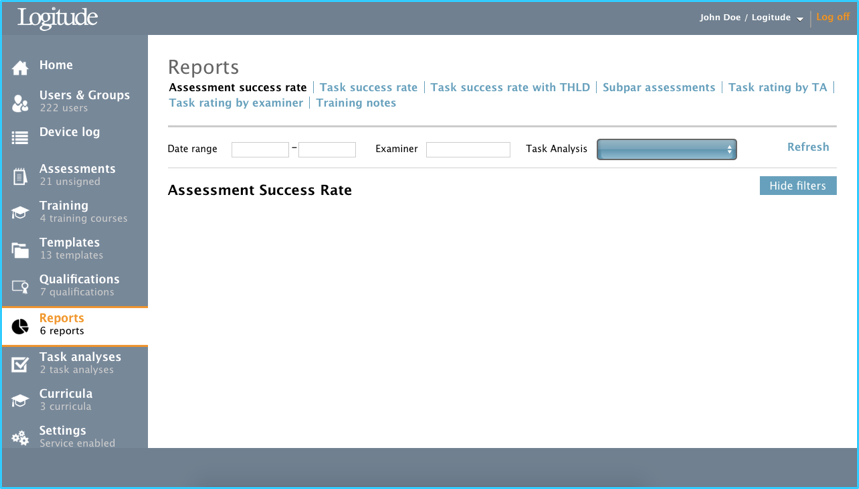
Note! Report data is generated only after clicking “Refresh” button. This is to avoid server load when browsing different report types. To generate reports, first select report type from the tab menu, then adjust filters as needed and then finally click “Refresh” to generate the report.
Data Analysis Reports from the Performance and Proficiency Database (PPDB)
Different report types are “tabs” on the top portion of the view. Each report type has filtering criteria available to filter the data, e.g. by date range, by trainee, by examiner, by Task Analysis, etc. After selecting the report type (tab) and the filtering criteria, the report is executed with the “Refresh” link and the Report data is displayed on the page.
Assessment success rate
This report displays the assessment success rate, i.e. the “Overall grading” distribution for the assessments matching the filtering criteria.
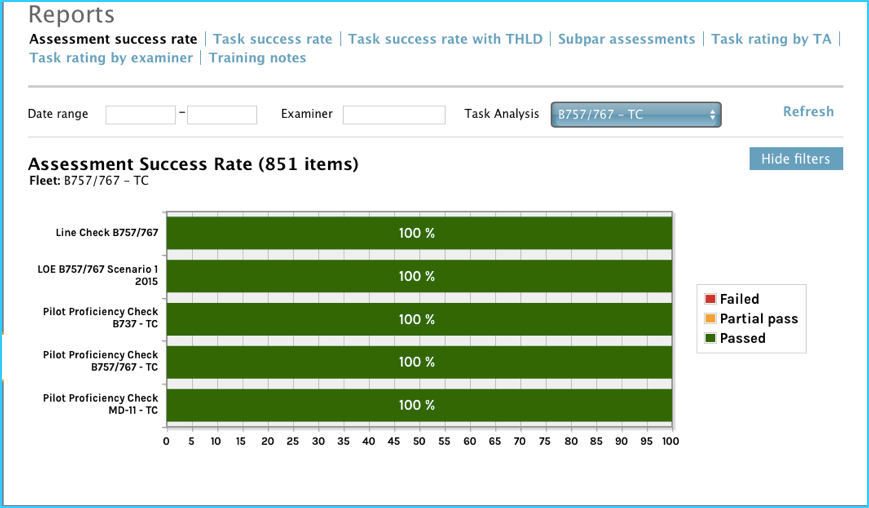
Available filters:
- Date range: assessment “signed” date range. If not provided, all assessments included.
- Examiner: user who submitted the assessments. If not provided, all examiners included.
- Task Analysis: task analysis to which the template is based on. If not provided, all TA’s included.
Task success rate
This report displays the task success rate, i.e. the grading statistics for different tasks for the assessments matching the filtering criteria. The tasks are displayed in the order of “worst performance on top.”
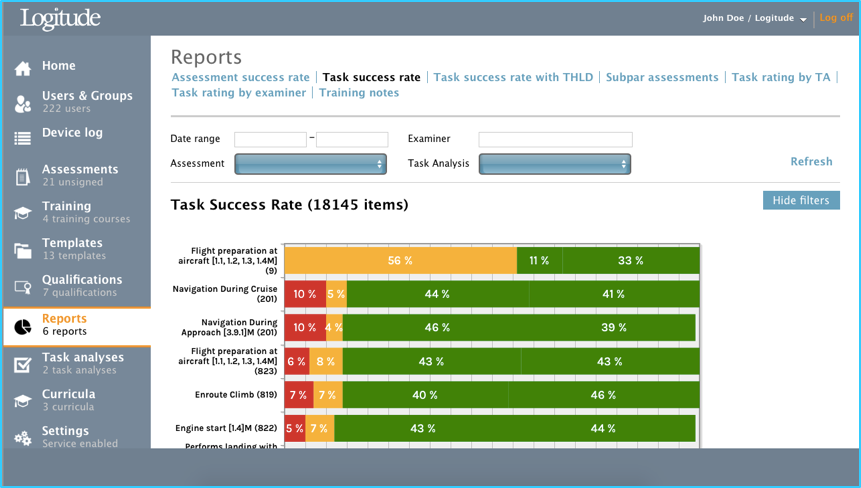
Available filters:
- Date range: assessment “signed” date range. If not provided, all assessments included.
- Examiner: user who submitted the assessments. If not provided, all examiners included.
- Assessment: the form template used. If not provided, all form templates are included.
- Task Analysis: task analysis to which the template is based on. If not provided, all TA’s included.
Available drill downs:
-
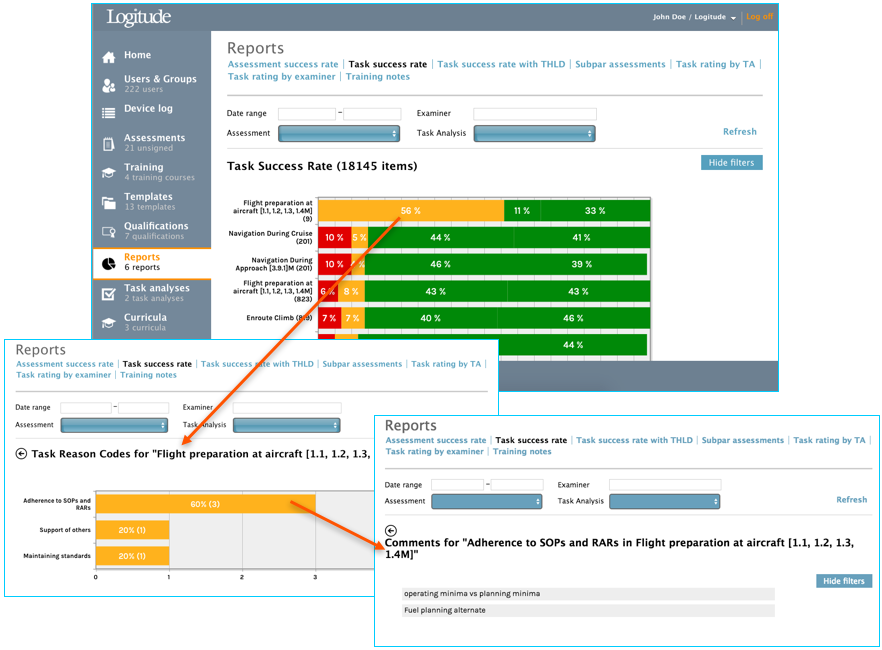
Double clicking a task’s grading distribution bar on the diagram opens up the Reason Code distribution of that task. The reason codes are shown in descending order with the most common on top.
-
Double clicking a reason code’s distribution bar on the diagram opens up the input comments for that reason code. The comments are shown in chronological order.
Task success rate with THLD
This report shows success rate for each task with a configurable threshold. Tasks are listed in alphabetical order and shown as columns on the horizontal axis. The grade scale for each task is represented on the vertical axis. Threshold runs as a line across the task, and can be configured from the filters section.
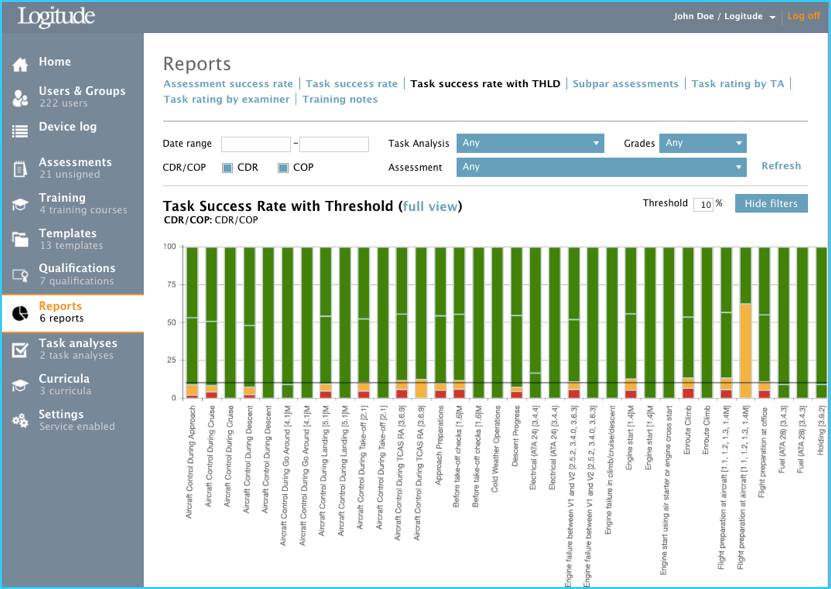
Available filters:
- Date range: assessment “signed” date range. If not provided, all assessments included.
- Task Analysis: task analysis to which the template is based on. If not provided, all TA’s included.
- Grade: Filter results to contain only specific grades.
- CDR/COP: Filter results to contain only selected roles
- Assessment: the form template used. If not provided, all form templates are included.
Other functions:
- Click “full view” link to open only the reports section in a new tab.
- Configure threshold from 0-100% to adjust the threshold bar across the scales.
Available drill downs:
- Clicking any grade scale shows the complete details regarding the clicked task with behavioral indicator under each grade given. Click any behavioral indicator under each grade to see all comments given for that grade.
Subpar assessments
This report displays assessments which contain tasks which have been graded with a substandard grade and which match the filtering criteria input by the user. The assessments are shown in chronological order, newest on top.
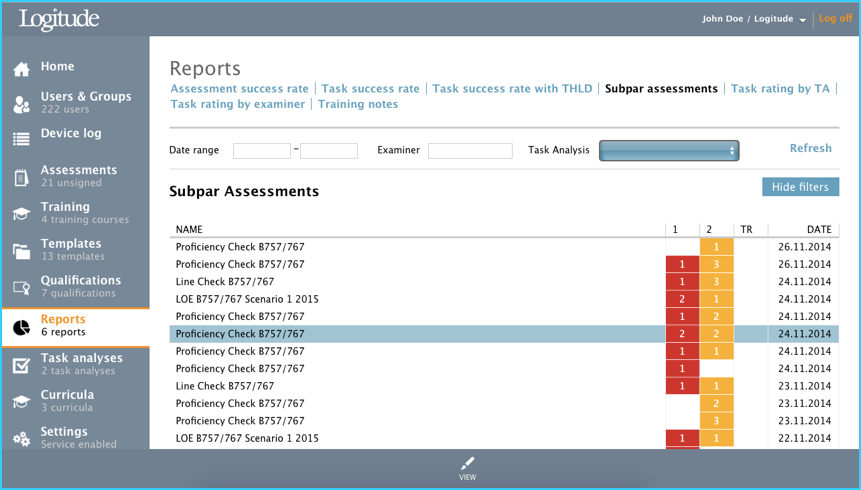
Available filters:
- Date range: assessment “signed” date range. If not provided, all assessments included.
- Examiner: user who submitted the assessments. If not provided, all examiners included. Task Analysis: task analysis to which the template is based on. If not provided, all TA’s included.
Available drill downs:
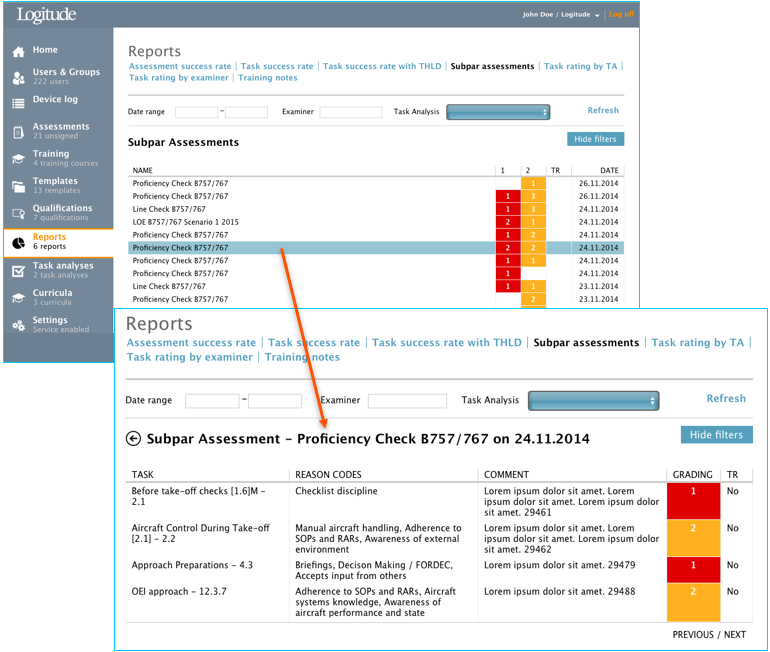
- Double-clicking an assessment on the list, or selecting an assessment and clicking toolbar button “View” shows the complete details regarding the assessment’s substandard tasks, reason codes, comments and training recommendations.
Task Rating by Task Analysis
This report displays the overall task rating for each task analysis making the filtering criteria input by the user.
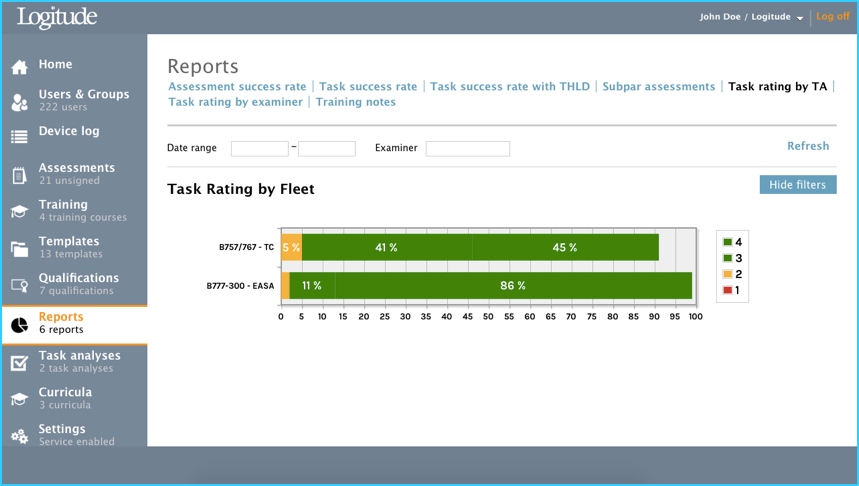
Available filters:
- Date range: assessment “signed” date range. If not provided, all assessments included.
- Examiner: user who submitted the assessments. If not provided, all examiners included.
Task Rating by examiner
This report displays the overall task rating given by each examiner matching the filtering criteria input by the user. The data is displayed in descending order with the examiner/instructor giving the most “substandard” grades on top.
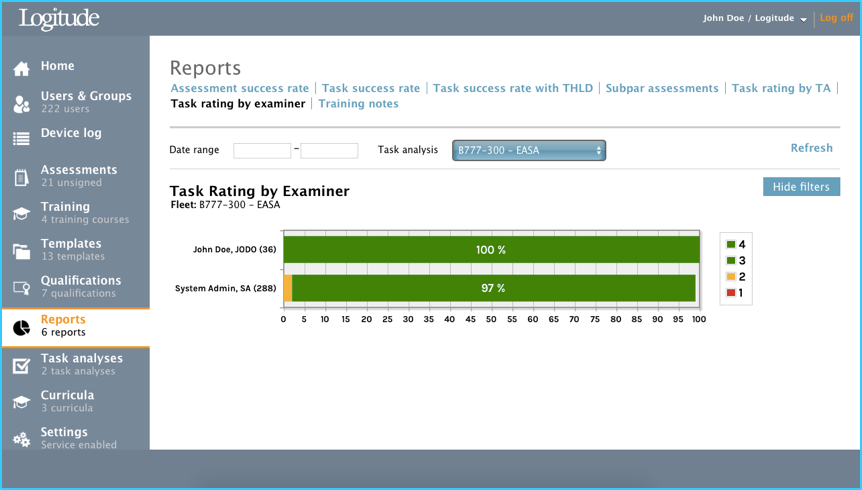
Available filters:
- Date range: assessment “signed” date range. If not provided, all assessments included.
- Task Analysis: task analysis to which the template is based on. If not provided, all TA’s included.
Training notes
Training notes are comments written by instructors/examiners to the Training note field of the footer of an assessment form. Training notes can be used to relay information from the examiner to the training department regarding some other matters than the actual trainee performance, such as snags regarding the training devices, simulator downtime, comments/suggestions regarding the form template, etc.
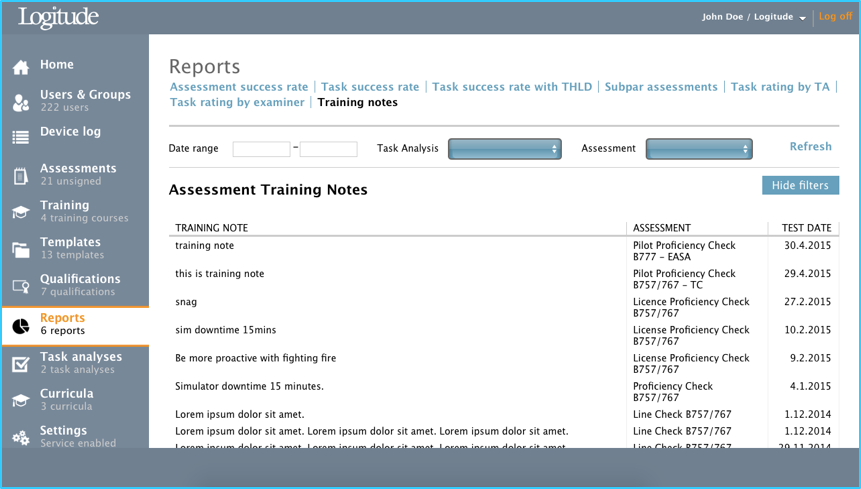
Available filters:
- Date range: assessment “signed” date range. If not provided, all assessments included.
- Task Analysis: task analysis to which the template is based on. If not provided, all TA’s included.
- Assessment: the form template used. If not provided, all form templates are included.
Available drill downs:
- Double clicking a training note on the list opens the actual assessment form from which the note was sent.